Multi-layer Interactive Maps in Tableau
A common approach to storytelling is to “Drill Down” and to “Zoom Out”.
This is the idea of starting with the larger picture before getting into the finer details and vice versa.
We’re going to build a map drill down with dynamic zone visibility. This is by stacking multiple geo encoded maps one on top of the other in a dashboard and controlling each map’s visibility using parameters.
Case Objective
We have a tree census dataset of New York City’s 5 boroughs. Each tree has location information:
- Borough.
- Zip Code.
- NTA - Neighborhood tabulation area.
The objective is to build a 3-layer interactive map using Tableau.
Methodology
| What we need? | How Many? |
|---|---|
| Parameters | 5 |
| Calculated fields | 3 |
| Dashboard actions | 5 |
The multilayer interactive map are just 3 maps positioned in the same dashboard container with specific rules on when they are in/visible.
So the rules are set to make the current map disappear and a deeper leveled map visible when a point on the map is selected.
Map 1 - The Boroughs
The map contains NYC’s 5 Boroughs.
Parameter - Borough
This parameter is populated only when a point on the Borough map is selected and otherwise becomes empty.
Create a string type parameter and set NO current value.
Parameter - Borough Filter
Create a string type parameter and set current value to ‘Queens’.
Calculated Field - DZV Borough
DZV - Dynamic Zone Visibility. The Borough map should be displayed when:
- any point on the final map (NTA map) is selected, or
- any area outside one of the maps is selected.
1
2
3
4
5
6
7
8
9
10
11
12
13
([Borough Parameter] = ''
 AND
 [Zip Parameter] = ''
 AND
 [NTA Parameter] != ''
)
OR
([Borough Parameter] = ''
 AND
 [Zip Parameter] = ''
 AND
 [NTA Parameter] = ''
)
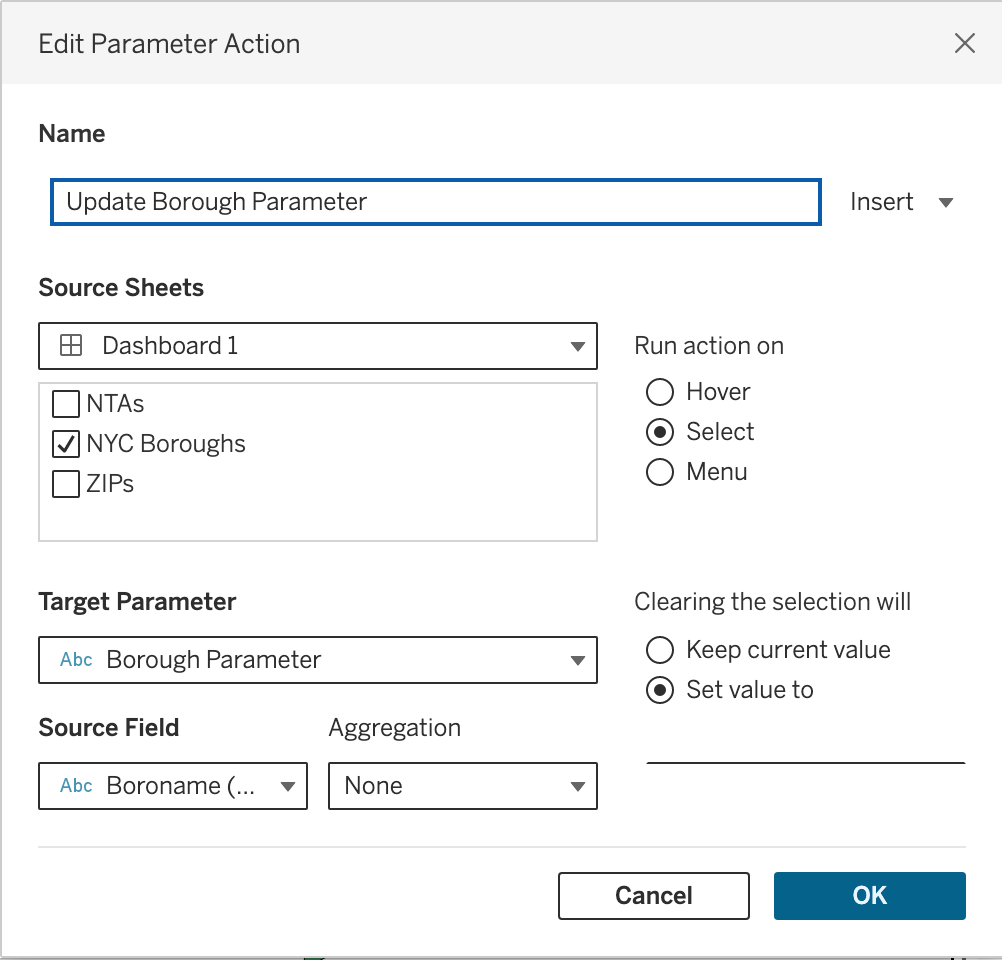
Dashboard Actions - Update Borough Parameter
The Borough parameter is used to figure out when to replace the Borough map with the selected Borough’s Zipcode map.
If
Manhattanis selected, the Borough Parameter is updated toManhattanand back toemptywhen the selection is cleared.
The selection is cleared by:
- Selecting an area/ point off map - Double click with a pause between clicks.
- Selecting an area on a different map - Selecting a Zip or NTA on a deeper level map.
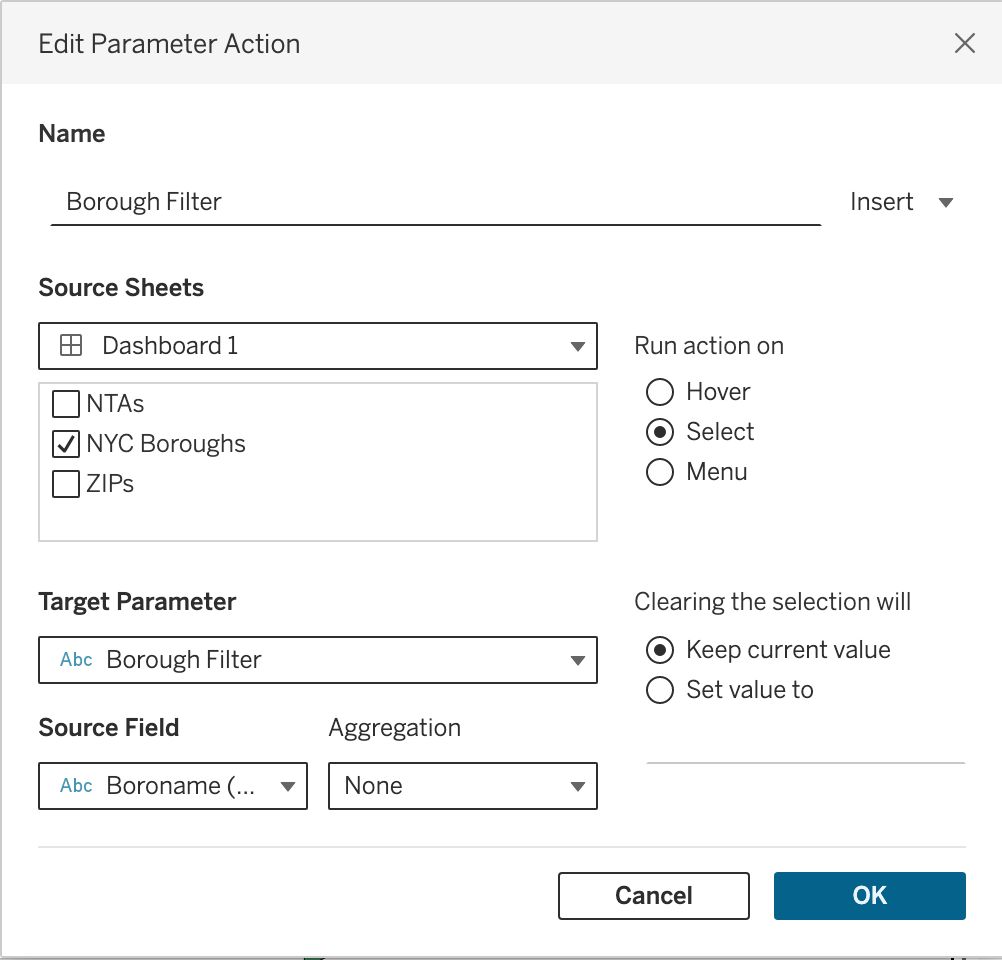
Dashboard Actions - Update Borough Filter
The Borough filter is used to understand which Borough is selected and to make invisible all other datapoints at the deeper level maps.
If
Manhattanis selected, we only wish for Manhattan’s Zipcodes to be populated in the deeper Zipcode map.
 |  |
Map 2 to Map N-1
Follow the same steps as for the top layer map (Borough) with 2 parameters, 2 dashboard actions to update those parameters and 1 calculated field to control map visibility.
Final Map N
The final map does not have a filter parameter and it’s associated update filter action. But the rest of the steps remain the same as above.
Dynamic Zone Visibility
Dynaic zone visibility or DZV is the interactive mode of these multi layer maps where the focus of the map changes with user interaction.
We do this by stacking all of these maps onto the same dashboard container and controlling the visibility of each map using a calculated field per map. 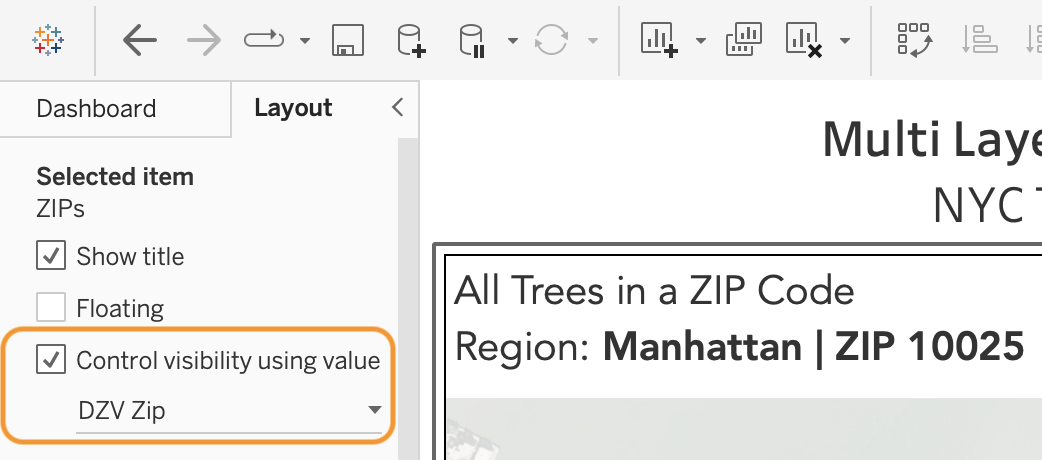
Dashboard
Double-clicking an area in the dashboard zooms in the area.
Pausing for a second between the first and second click resets to the Borough View.
