Time Series Plot with Shaded Error Region
1
2
3
4
5
6
7
8
9
10
11
...
ax = plt.subplot()

ax.set_xticks([iter for iter in hour if iter % 2 == 0])
ax.set_yticks([0, 20, 40, 60, 80, 100, 120])

y_upper = [i + (i * 0.15) for i in viewers_hour]
y_lower = [i - (i * 0.15) for i in viewers_hour]

plt.fill_between(hour, y_lower, y_upper, alpha=0.2)
plt.show()
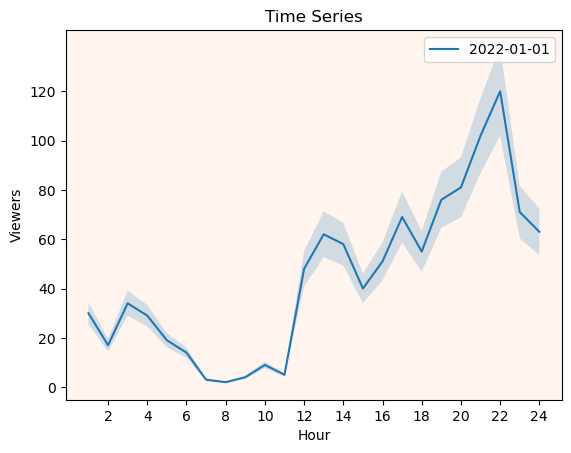
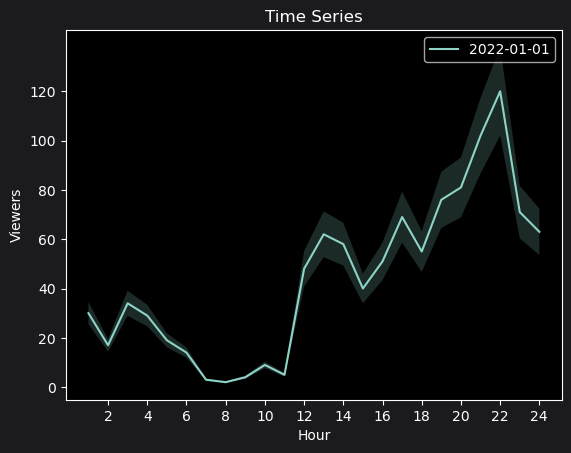 Time series plot with shaded error region
This post is licensed under CC BY 4.0 by the author.