Wrap Graph Labels in Matplotlib
Overlapping text labels on the x-axis is a common challenge during visualizations. To mitigate, we can rotate the labels by an angle to create more space, implement text wrapping for multi-line visibility, or combine both:
Code
1
2
3
4
5
6
7
8
import textwrap
def wrap_labels(ax, width, break_long_words=False):
    labels = []
    for label in ax.get_xticklabels():
        text = label.get_text()
        labels.append(textwrap.fill(text, width=width,
                                    break_long_words=break_long_words))
    ax.set_xticklabels(labels, rotation=30) # Change the rotation to suit preferences.
This provides clearer visualizations of our data.
Plots
| Before Text Wrap | After Text Wrap |
|---|---|
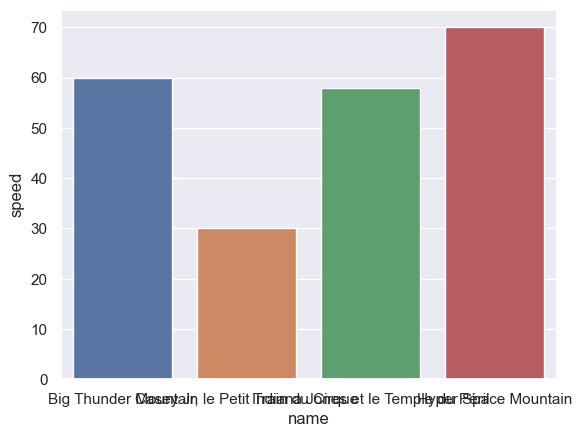 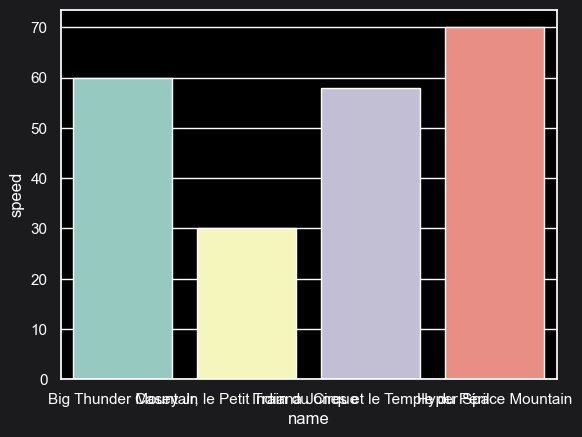 | 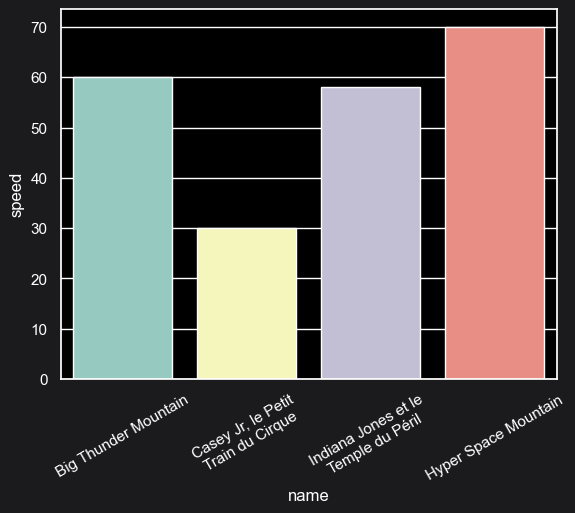 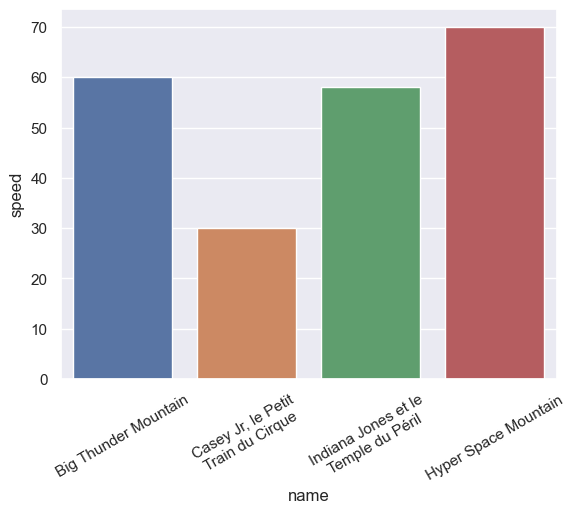 |
This post is licensed under CC BY 4.0 by the author.